>> nominal(It will take for a while.)
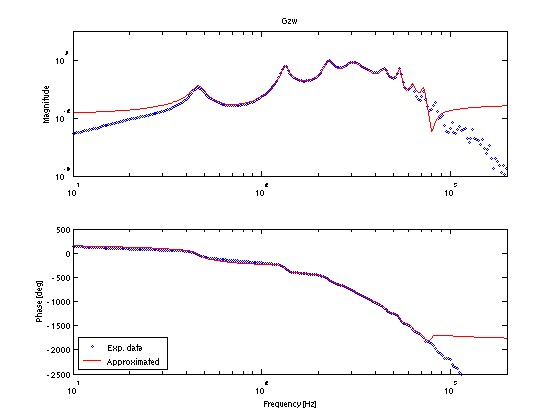
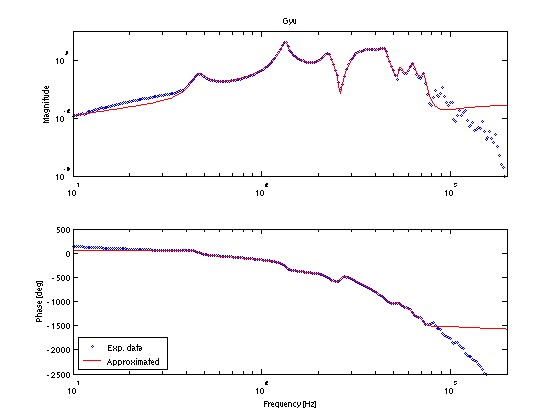
As the result, Bode plot of the approximated nominal plant and the original frequency response data are plotted for the four transfer functions, i.e. Gzw(s), Gyw(s), Gzu(s), and Gyu(s).
Confirm that the approximated nominal plant and the frequency response data are overlapped each other in the middle frequency range from about 50 Hz to 500 Hz.
Example:

Approximated nominal plant (red curve) and frequency response (blue points) for Gzw(s)

Approximated nominal plant (red curve) and frequency response (blue points) for Gyw(s)

Approximated nominal plant (red curve) and frequency response (blue points) for Gzu(s)

Approximated nominal plant (red curve) and frequency response (blue points) for Gyu(s)