Firstly, load the frequency response data by:
>> load spk1.datNext, confirm that the data is correctly loaded by:
>> format short e
>> spk1

ans =

   1.0000e+01   5.8768e-04   1.4745e+02   8.6876e-04   1.6989e+02
   1.0471e+01   4.7654e-04   1.4666e+02   1.0431e-03   1.6208e+02
   1.0965e+01   7.4107e-04  -2.2723e+02   1.1267e-03  -2.0344e+02
   1.1482e+01   7.1716e-04  -2.1929e+02   1.2773e-03  -2.0144e+02
   1.2023e+01   9.2359e-04   1.3304e+02   1.4885e-03   1.5287e+02
   1.2589e+01   9.1276e-04   1.2684e+02   1.6918e-03   1.4954e+02
   1.3183e+01   1.0547e-03  -2.3451e+02   1.9434e-03  -2.1453e+02
   1.3804e+01   1.1024e-03   1.2155e+02   2.2507e-03   1.4110e+02
   1.4454e+01   1.1892e-03   1.2158e+02   2.5899e-03   1.3916e+02
   1.5136e+01   1.4463e-03  -2.4348e+02   3.0333e-03  -2.2394e+02
(中略)
   1.2023e+03   1.4368e-03   1.4637e+01   2.5930e-03   2.0614e+02
   1.2589e+03   8.6975e-04  -1.9890e+01   3.4250e-03  -1.7094e+02
   1.3183e+03   9.9568e-04   2.2794e+02   4.3315e-04   8.9225e+01
   1.3804e+03   1.1055e-03   1.7386e+02   2.0125e-03   1.7387e+02
   1.4454e+03   1.3002e-03   7.6828e+00   6.5796e-04   6.3891e+01
   1.5136e+03   1.3388e-03   2.3266e+02   1.2286e-03   6.0970e+01
   1.5849e+03   1.0311e-03   1.2270e+02   1.6596e-03   7.9986e+01
   1.6596e+03   4.2806e-04   3.5013e+01   4.2572e-04   8.3348e+01
   1.7378e+03   2.4791e-04  -8.2351e+01   3.7587e-04  -6.9418e+00
   1.8197e+03   3.3969e-04  -2.5462e+02   4.3694e-04  -2.9834e+01
   1.9055e+03   3.2147e-04  -3.3319e+01   1.7681e-04  -4.8122e+01
In the above execution, exponential form is chosen to display numerics for simplicity of appearance.
The 1st column of the above is test frequencies [Hz], the 2nd and the 3rd columns are gain and phase characteristics from w to z respectively, and the 4th and 5th columns are gain and phase characteristics from w to y respectively.
Since our interest here is gain characteristic from w to y, the 4th column is plotted against the 1st column by:
>> loglog(spk1(:,1),spk1(:,4),'.-')
>> grid on
where `loglog' makes log-log scale plot, and '.-' means dashdot curve.
The frequencies of upward and downward peaks are called resonance frequency and anti-resonance frequency, respectively.
Example:

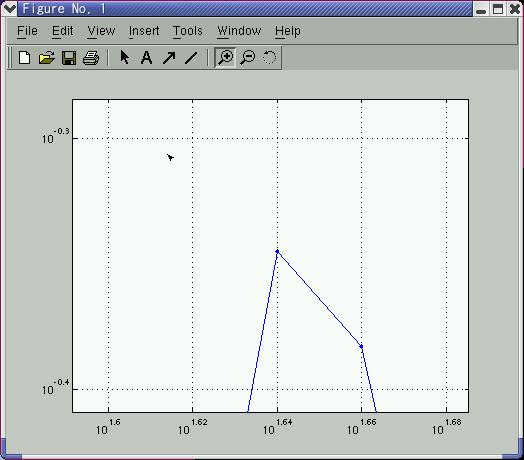
Use `Zoom in' button to magnify the peaks in detail, and read the 1st and 2nd resonance and anti-resonance frequencies.
Example(the 1st resonance peak is magnified):

In the above example, the 1st resonance frequency is obtained by
>> 10^1.64

ans =

   4.3652e+01
Note that the character `^' above means power.
Similarly read the other frequencies and complete the table below:
| 1st | 2nd | |
| resonance frequency | 44 Hz | ? Hz |
| anti-resonance frequency | ? Hz | ? Hz |
- open-and-closed-ended acoustic duct
The resonance frequencies (fr) and anti-resonance frequencies (fa) are given by
fr = (2m+1)c / (4L)
fa = mc / (2L)
where m = 0, 1, 2, ... , L is duct length [m],c is speed of sound [m/sec].
- closed-and-closed-ended acoustic duct
fr = mc / (2L)
fa = (2m+1)c / (4L)
It is interesting that the values of fr and fa are exchanged compared to open-and-closed-ended duct case.
Calculate the frequencies and complete the table below
| m = 0 | m = 1 | m = 2 | |
| fr | ? Hz | ? Hz | ? Hz |
| fa | ? Hz | ? Hz | ? Hz |